
One of the fun projects I was able to work on over the past few months was in creating a quick diagnostics dashboard for a live survey at a conference. The ask was simple:
I have a 20 minute conference presentation. I need to create a survey that attendees can access on their phone / laptop, and present the results of the survey before the session is over.
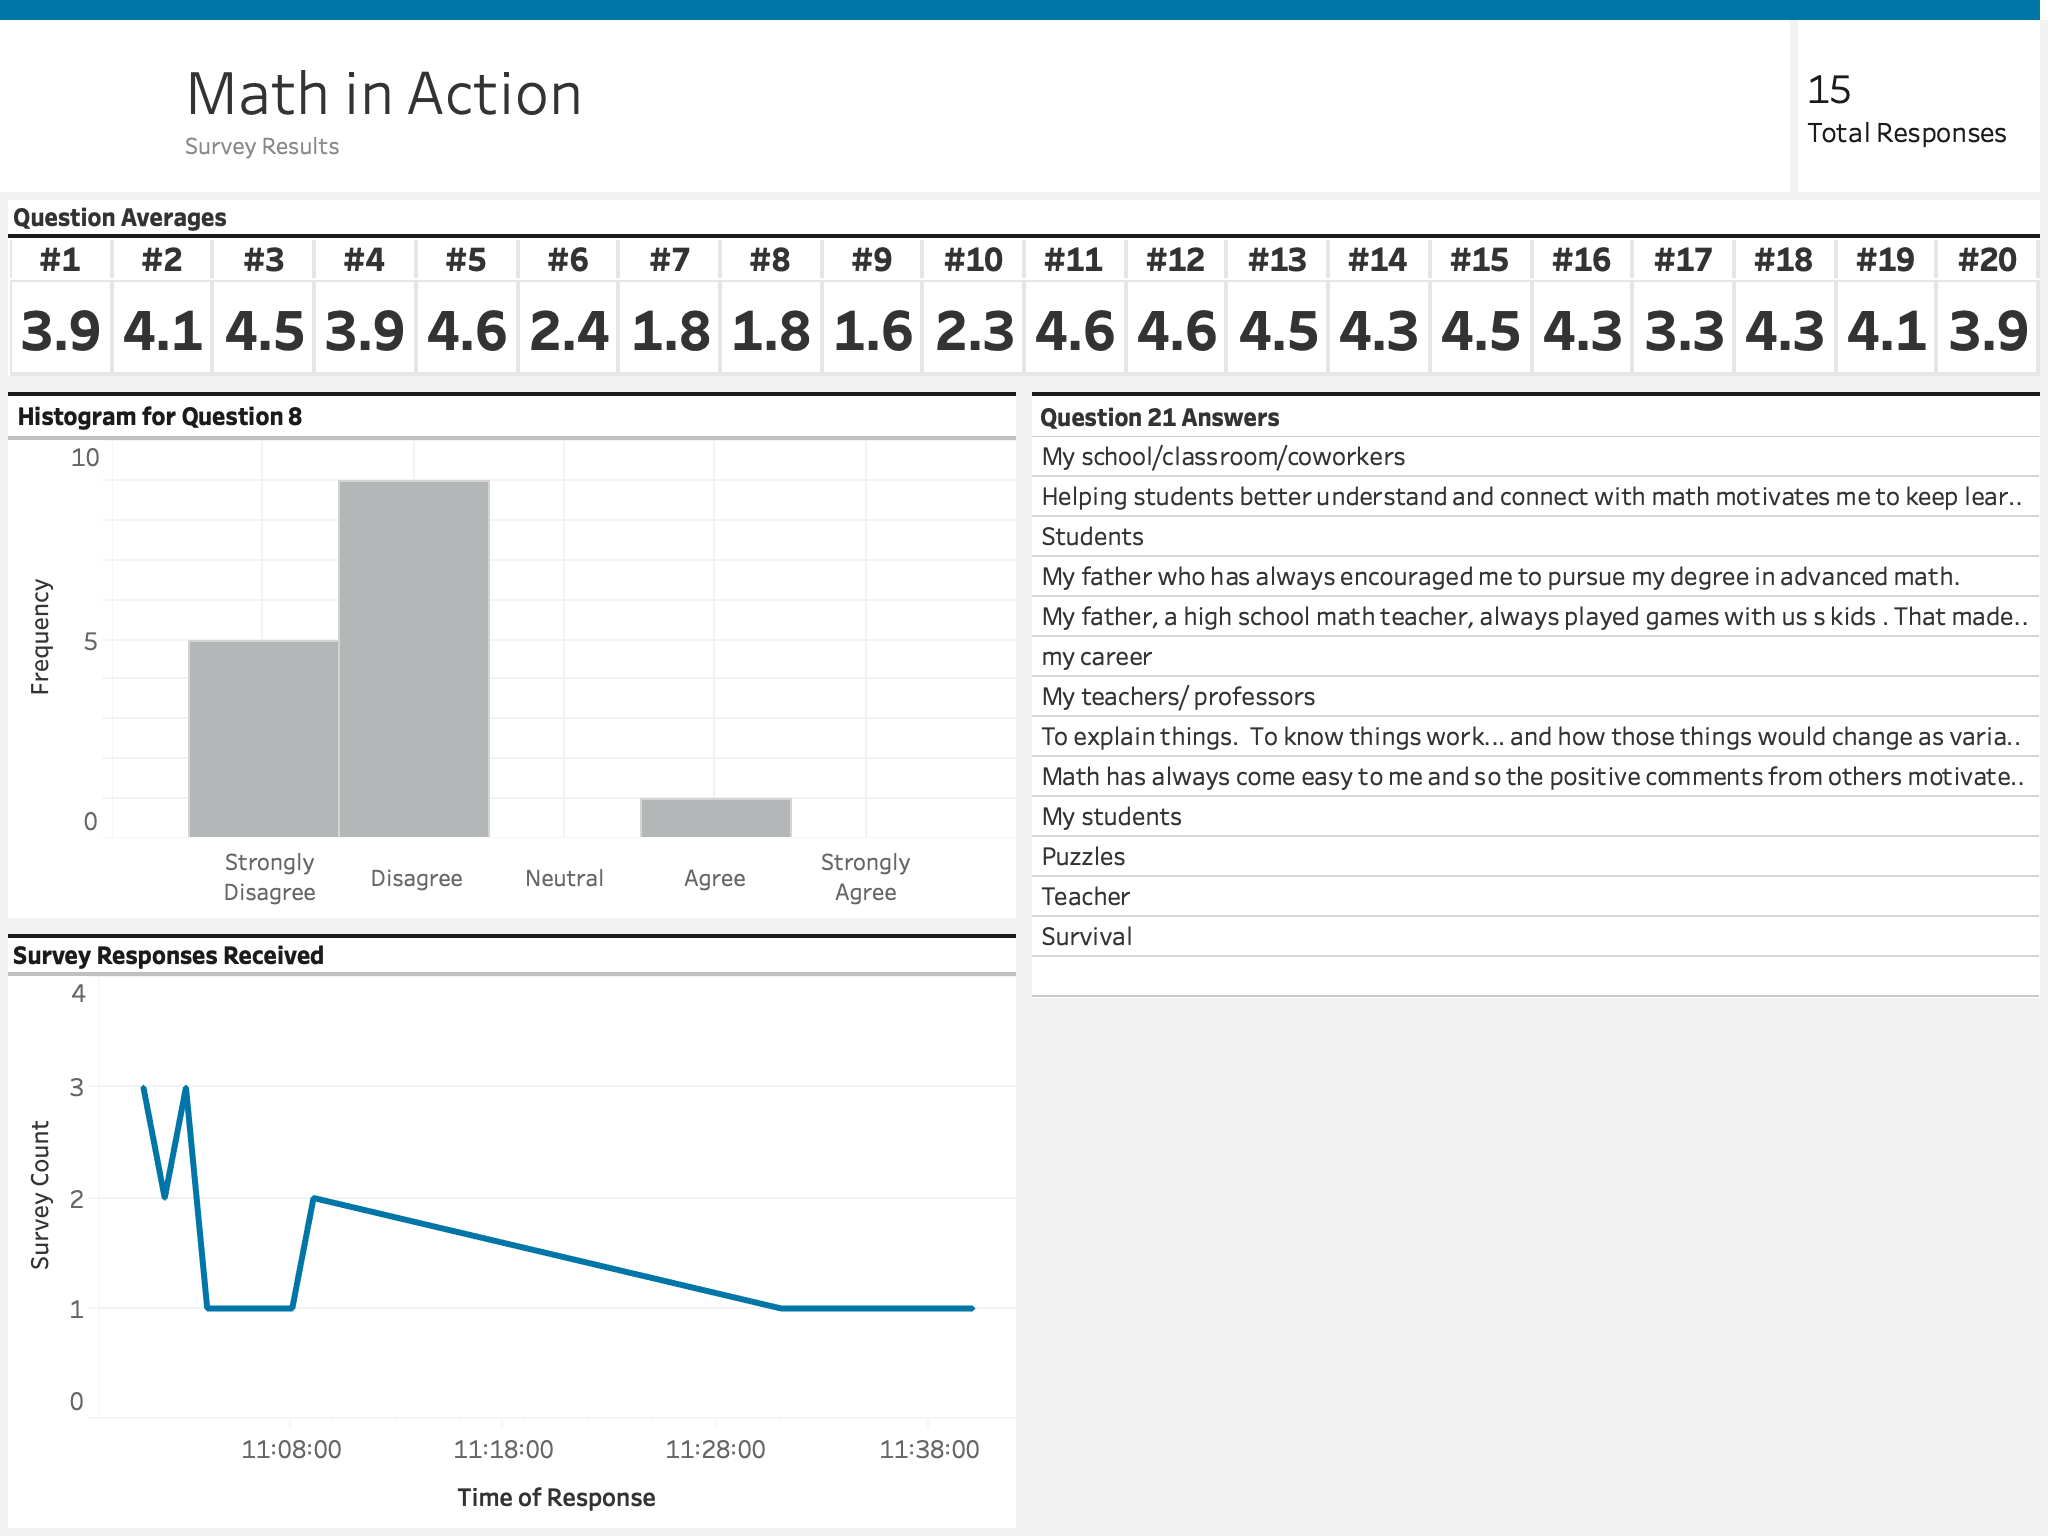
The survey was 20 questions long, with one free-form question, and the other 20 questions as rating from 1-5 (strongly disagree to strongly agree) where the interesting measure was the average. What was the fastest and easiest way to do this?
1. Google Forms
Since the person creating the survey didn’t want to code anything by hand, but wanted something responsive and easy to use, google forms is the natural solution. Here we were able to dump the results of the survey into a google sheet and create a quick and reusable “database” backend.2. Tableau Public
Since we weren’t collecting any sensitive information (Name, Age, etc), we used Tableau, and Tableau Public for a front-end interface. Tableau was able to directly fetch from a Google Sheet using the built-in connector. Unfortunately, this isn't a live connection, but we found a workaround using the "Update Now" button that appears with a Google Sheets connection.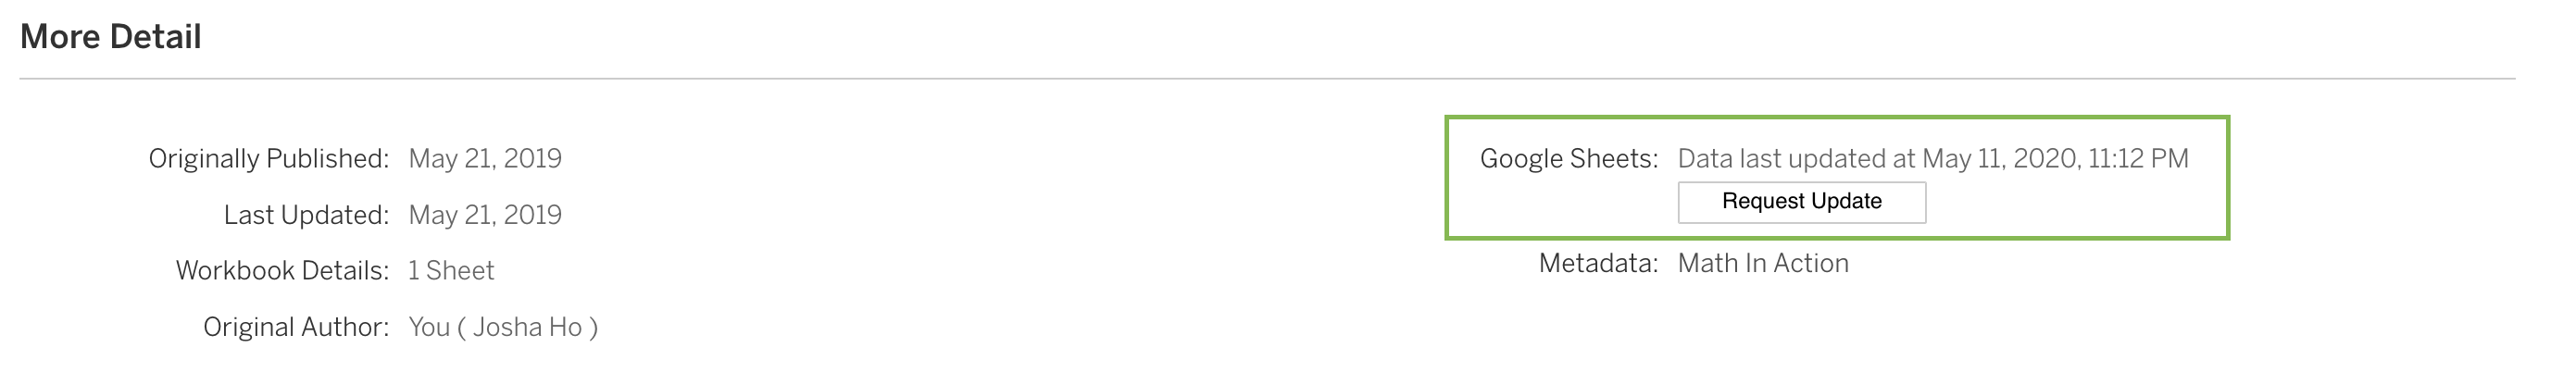
So, in summary, using Tableau Public (free), Tableau Desktop (monthly license, or free for students/teachers), and Google Sheets, we created a customized survey platform that collected results from the audience via web browser, calculated any measures that were necessary, and displayed the results on a query refresh to help demonstrate the survey in a tangible context.